How to speed up the issue investigation time and help to eliminate complex problems
If you ran into an unusual problem, you may greatly help the DevExpress Support Team in investigating the issue by providing as much information as possible. Having this information will increase the chances and the speed that the issue will be fixed. Once the issue is fixed, you are always welcome to request a daily build containing the fix from the Support Team.
First of all, the basic information is required:
- Version of the product installed. This can be seen in the DevExpress | About window or Visual Studio About window.
- Screenshots or a video that represent your problem. For instance, you can capture it using the free Jing tool from TechSmith.
Secondly, specific information is necessary. For different kind of issues, various information is valuable. See the appropriate section below, to learn more on which information is important.
Instability issues
If you see VS IDE instability in which IDE Tools might be involved, it would be useful to capture the problem’s call stack. Follow these steps to do this:
1) Prepare a debugging project:
- Open Visual Studio.
- Create a new C# class library called “DebugLibrary”.
- Delete the “AssemblyInfo” and “Class1” files from the new project.
2) As soon as the issue is reproduced, launch a new Visual Studio instance, and open the DebugLibrary project.
3) Click the “Debug | Attach to Process…” menu, select the “problematic” Visual Studio instance in the “Available Processes” list;
4) Click the “Select…” button near the “Attach to:” edit box, and activate the “Managed” option in the “Select Code Type” dialog.
5) Click the “Attach” button to start debugging.
6) In the debugger, press Ctrl+Alt+Break to Break All.
7) Open the “Threads” (“Debug | Windows | Threads”) and “Call Stack” (“Debug | Windows | Call Stack”) tool windows.
8 ) Right-click the “Call Stack” tool window and activate the “Show External Code” option.
9) Double-click a thread and copy its current call stack.
10) Save and send the entire call stack obtained from all threads, so the Support Team can look into it.
Performance issues
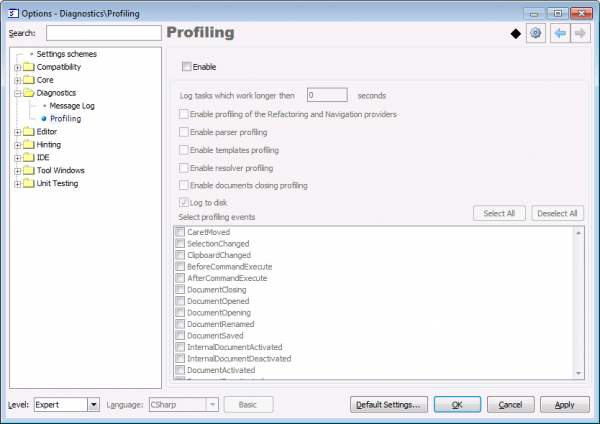
DXCore includes a special diagnostics plug-in that allows you to profile the main areas of the product and see which may cause delays in the Visual Studio IDE. Follow these steps, to collect the profiling information:
1) Go to the Profiling options page in the Diagnostics category in the Options Dialog:
2) Check the “Enable” checkbox
3) Check the “Enable profiling of the Refactoring and Navigation providers” checkbox
4) Check the “Enable parser profiling” checkbox
5) Check the “Enable templates profiling” checkbox
6) Check the “Enable resolver profiling ” checkbox
7) Check the “Enable documents closing profiling ” checkbox
8 ) Check the “Log to disk” checkbox if it is not checked
9) Click the “Select All” button to select all available events to profile
10) Work in the Visual Studio IDE until you hit a performance issue you’ve seen before. Please note, that when the profiling feature is enabled, it may slow down the IDE a bit more.
11) When you are done with working inside the IDE, close Visual Studio, open the Logs folder (specified on the Settings options page) and send the DXCore Profiling* log file to the DevExpress Support Team.
Don’t forget to disable the profiling to eliminate an additional load on the IDE.
—– Products: all Versions: 11.2 and up VS IDEs: 2008 and up Updated: May/15/2012 ID: T054