Duplicate Detection Visual Studio tool window
The Duplicate Code tool window allows you to review the duplicate code found in your entire solution. The tool window is available via the DevExpress | Tool Windows | Duplicate code menu item.
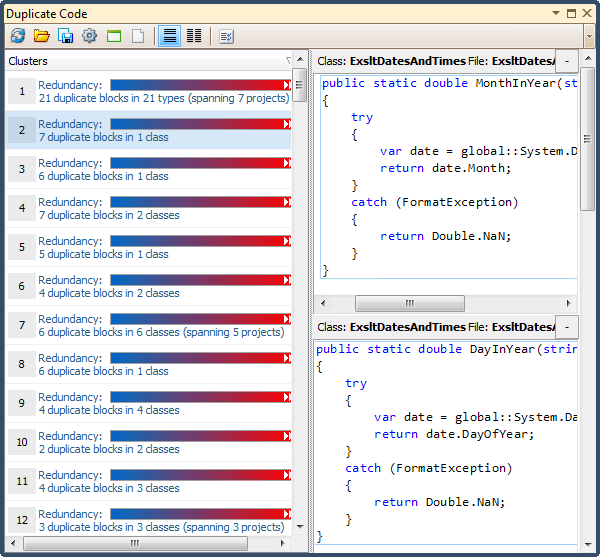
If the duplicate code analysis has been started, you will see the analysis results in the Clusters list on the left, otherwise, you can click the “Run duplicate code analysis” button to perform the duplicate code search. This is what it looks like:

The tool bar contains the following buttons:
|
Icon |
Name |
Description |
| |
Run duplicate code analysis | Starts the duplicate code analysis for the currently opened solution. |
| |
Open duplicate code analysis results | Imports previously saved duplicate code analysis data. |
| |
Save duplicate code analysis results | Exports the duplicate code analysis data for this solution for further investigation. |
| |
Options | Opens the Duplicate Code options page. |
| |
Group by Projects | Shows projects in the Cluster list and groups duplicate code clusters by them. |
| |
Group by Files | Shows files in the Cluster list and groups duplicate code clusters by them. |
| |
Horizontal layout | Changes the code view layout to horizontal. |
| |
Vertical layout | Changes the code view layout to vertical. |
| |
Toggle log | Toggles output window visibility where the log messages are sent. |
Clusters and code views
On the left, you can see the list of duplicate code clusters. A cluster consists of two or more functionally similar code blocks.
Clusters are sorted and indexed by the redundancy value in descending order. A redundancy is a measure of the redundant code based on its duplication. The greater the redundancy value, the more code that can be removed when the duplicated code is consolidated. Note that a cluster with a small duplicated code block may have a higher redundancy value than a cluster of a bigger duplicate code block because the smaller block has more duplications then the larger one.
Near the redundancy value, you can see how many duplicate code blocks are contained in each cluster and the number of classes these blocks reside in.
Selecting a cluster will display a number of duplicate code views on the right. Each code view has a header showing class name, file name and project where each duplicate code block is located. The source code for each duplicated code block appears below the header.
If you double click a cluster, the source code of the first duplicate code block will be opened in the Visual Studio code editor. You will see the Code Fix hint shown for the opened code block, and the mouse cursor will be positioned on the “Next duplicate block” button which allows you to navigate between duplicate code blocks.
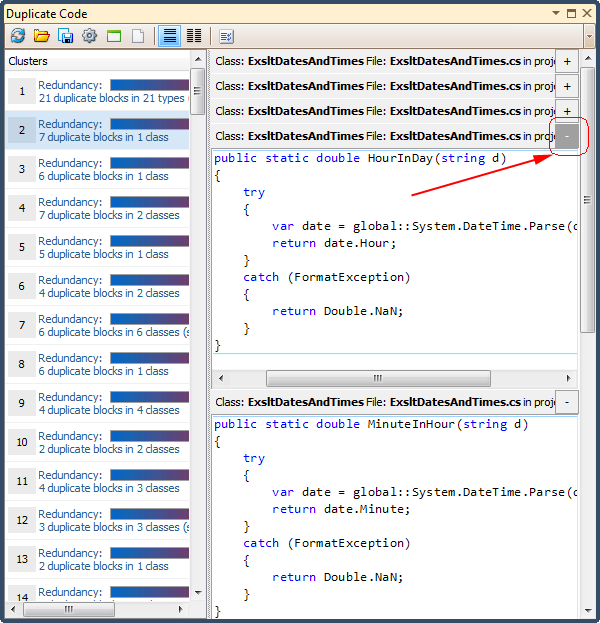
Code views can be arranged horizontally or vertically – using the orientation buttons on the toolbar to change the layout. In the horizontal layout, a code view can be collapsed by clicking the [-] button:

and then expanded by clicking the [+] button. Inside a code view, a light blue rectangle highlights the duplicated code.
Output
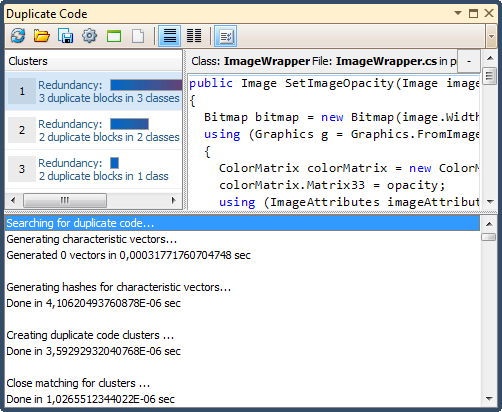
This part of the window contains messages logged about the current analysis progress and operations performed and the time each operation takes:

CodeRush also ships a stand-alone windows application that can be used outside of the Visual Studio IDE.
Want to learn more?
- Duplicate Detection and Consolidation Overview
- Duplicate Real-time detection in Visual Studio
- Duplicate Detection Using the Stand-alone Application
- Duplicate Consolidation inside Visual Studio
- Duplicate Detection analysis options
- Duplicate Detection in CodeRush versus Code Clone Analysis in Visual Studio 2011