Shared Source – Show Metrics
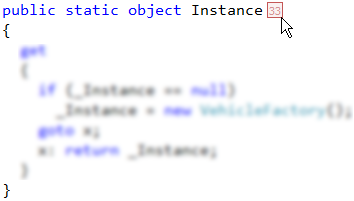
CodeRush Pro includes the Show Metrics (also known as Code Metrics) visualization feature, which is indented to evaluate code metrics right in the code editor while you are writing and/or reviewing the code. It shows a specific code metric for each method, property or event (with add and remove methods) near its declaration:

Code metrics itself is a set of software measures that provide developers with better insight into the code they are developing. Using code metrics allows program managers and developers to estimate complexity of a project already developed or even only being developed and to estimate the scope of work, stylistics of a program being developed and efforts of every developer participating in creation of a particular solution. By taking advantage of code metrics, developers can understand which types and/or methods should be reworked or tested more thoroughly.
However, metrics can only serve as recommendations, one cannot rely fully on them for developing software, programmers try to minimize or maximize this or that aspect of their program and can refer to various tricks up to reducing efficiency of the program’s operation.
The following metrics are available in the Show Metrics feature:
|
Metric Name |
Description |
| Cyclomatic Complexity | Measures the structural complexity of the code. It is calculated using the number of different code paths in the flow of the program. A program that has complex control flow will require more tests to achieve good code coverage and will be less maintainable. To learn more about this metric see the “Feeling the need for a new software metric” topic. |
| Line Count | Indicates the number of lines of code. A very high count might indicate that a type or method is trying to do too much work and should be split up. It might also indicate that the type or method might be hard to maintain. |
| Maintenance Complexity | This code metric is developed by IDE tools chief architect – Mark Miller. To some degree it combines elements of cyclomatic complexity and number of function calls plus property references inside a particular member. Every element of the code has a weighted point value, all the way down to local variable declarations, assignment statements, expressions in for loops, unary operations, etc. See the “Here’s your new code metric” topic for more details on this metric. |
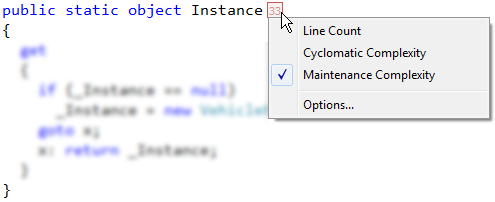
You can specify the shown metric by clicking on the Metric icon and choose it from the drop down menu:

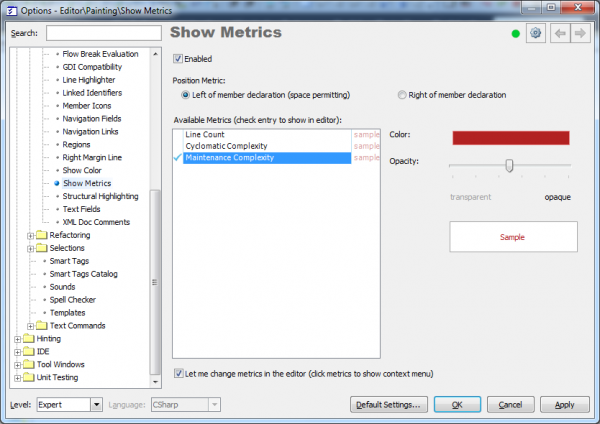
Or you can change it on the Editor | Painting | Show Metrics option page in the Options Dialog:
There are additional options you can specify for this feature on the options page:
- Enable or disable Code Metrics feature
- Position of the Metric icon: left of member declaration or right of member declaration
- Color and opacity for each code metric provider available
- Option that allows you to change metrics right in the code editor (by shown the drop down menu).
You are also able to quickly enable/disable this feature on the DXCore Visualize toolbar:

Refactor! Pro contains another feature for analyzing code metrics – it is the Metrics tool window, which shows you graphical presentation of code metrics for the entire source code tree.
You are welcome to add your own code metrics using the CodeMetricProvider DXCore component, which will be automatically available in both CodeRush’s Code Metrics feature and Refactor!’s Metrics tool window. The feature resides in the open source “CR_ShowMetrics” plug-in sample from the Shared Source solution.
—– Products: CodeRush Pro Versions: 10.1 and up VS IDEs: any Updated: Dec/10/2010 ID: C038